
November 3, 2026
Make Your Own: ASCII Weather
The view out your window is already a picture. This is the recipe for turning it into a living one: the view from my terrace, redrawn as a coarse grid of characters, driven by the real weather outside it right now. One photograph, one free weather feed, one HTML file, no libraries. It costs nothing. There is also a converter at the top of this post — feed it a photo and it turns the picture into characters, right in your browser.
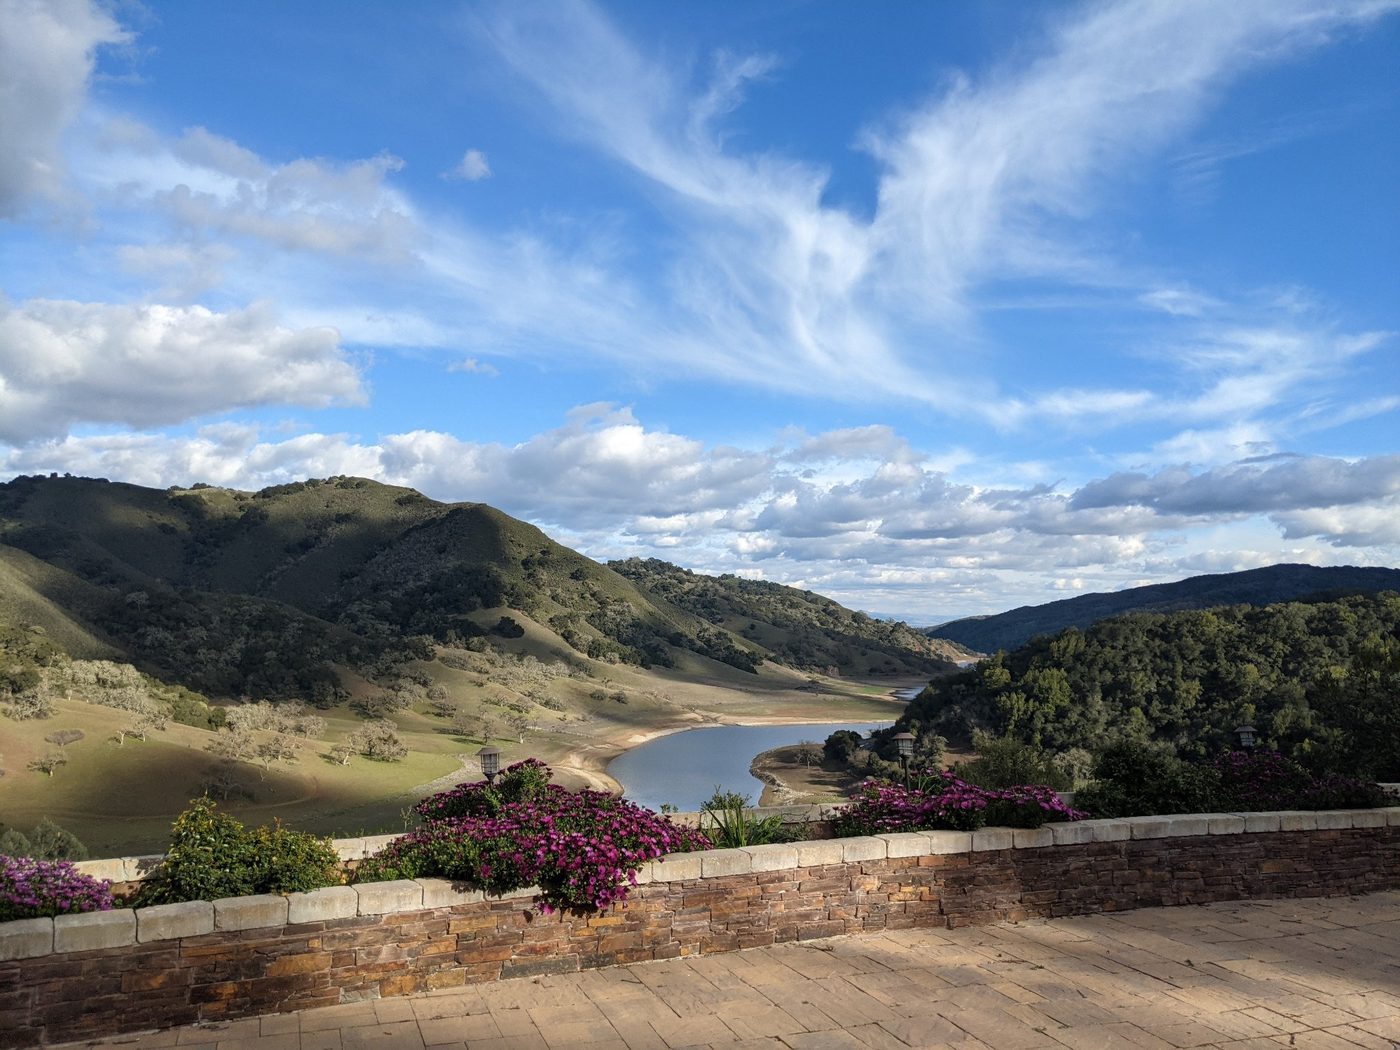
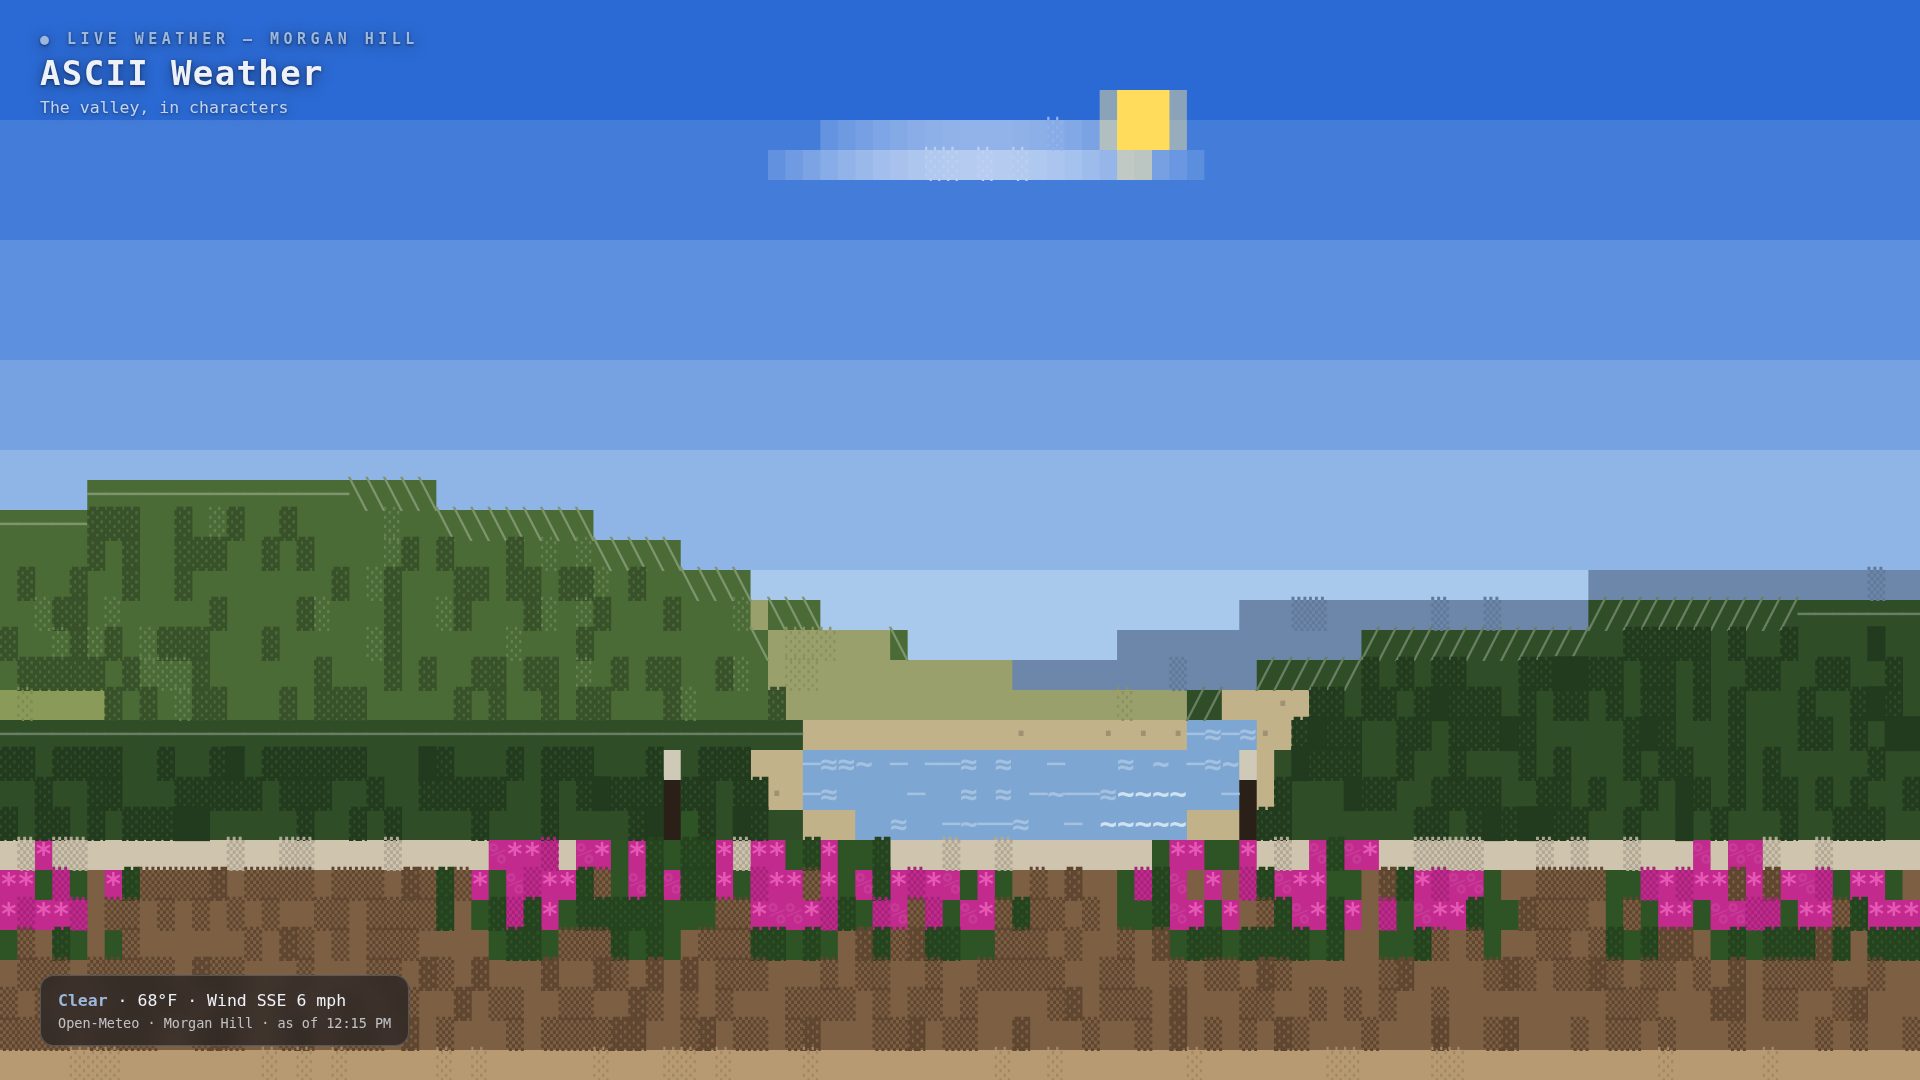
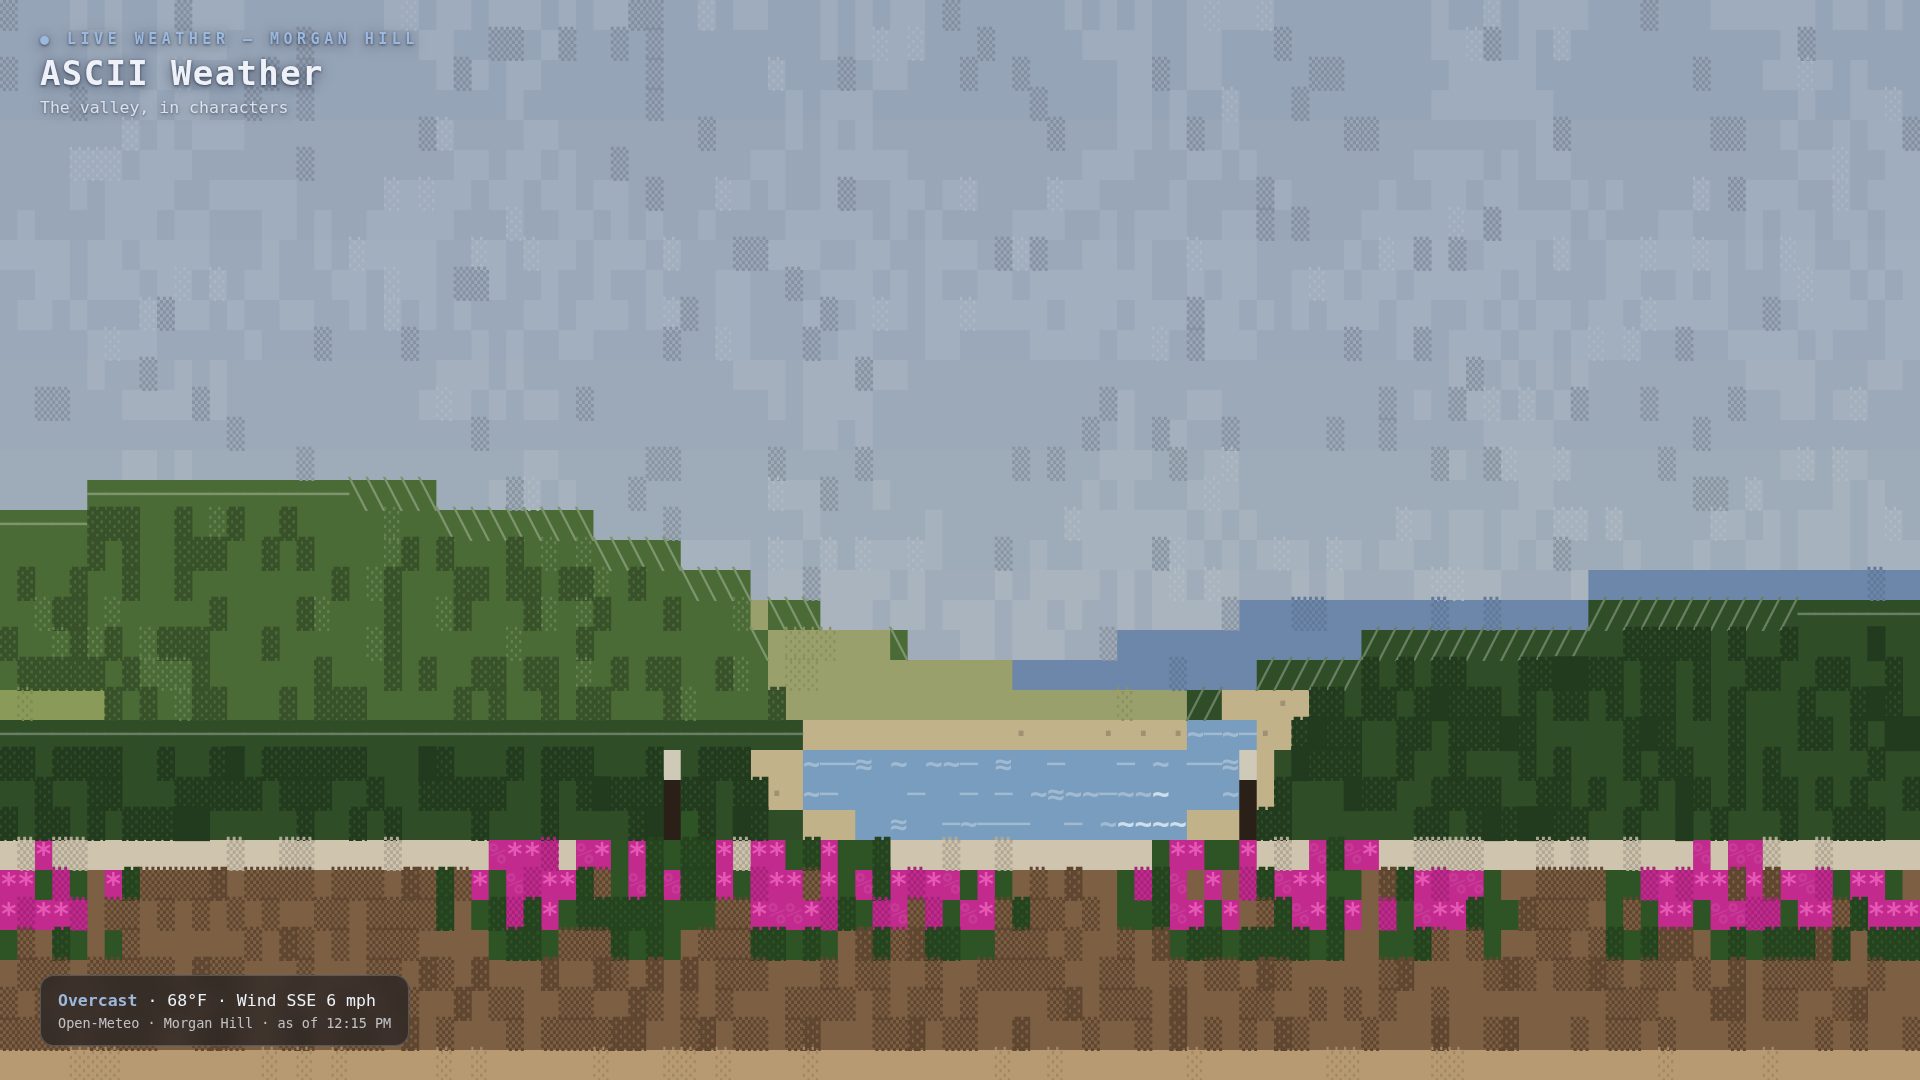
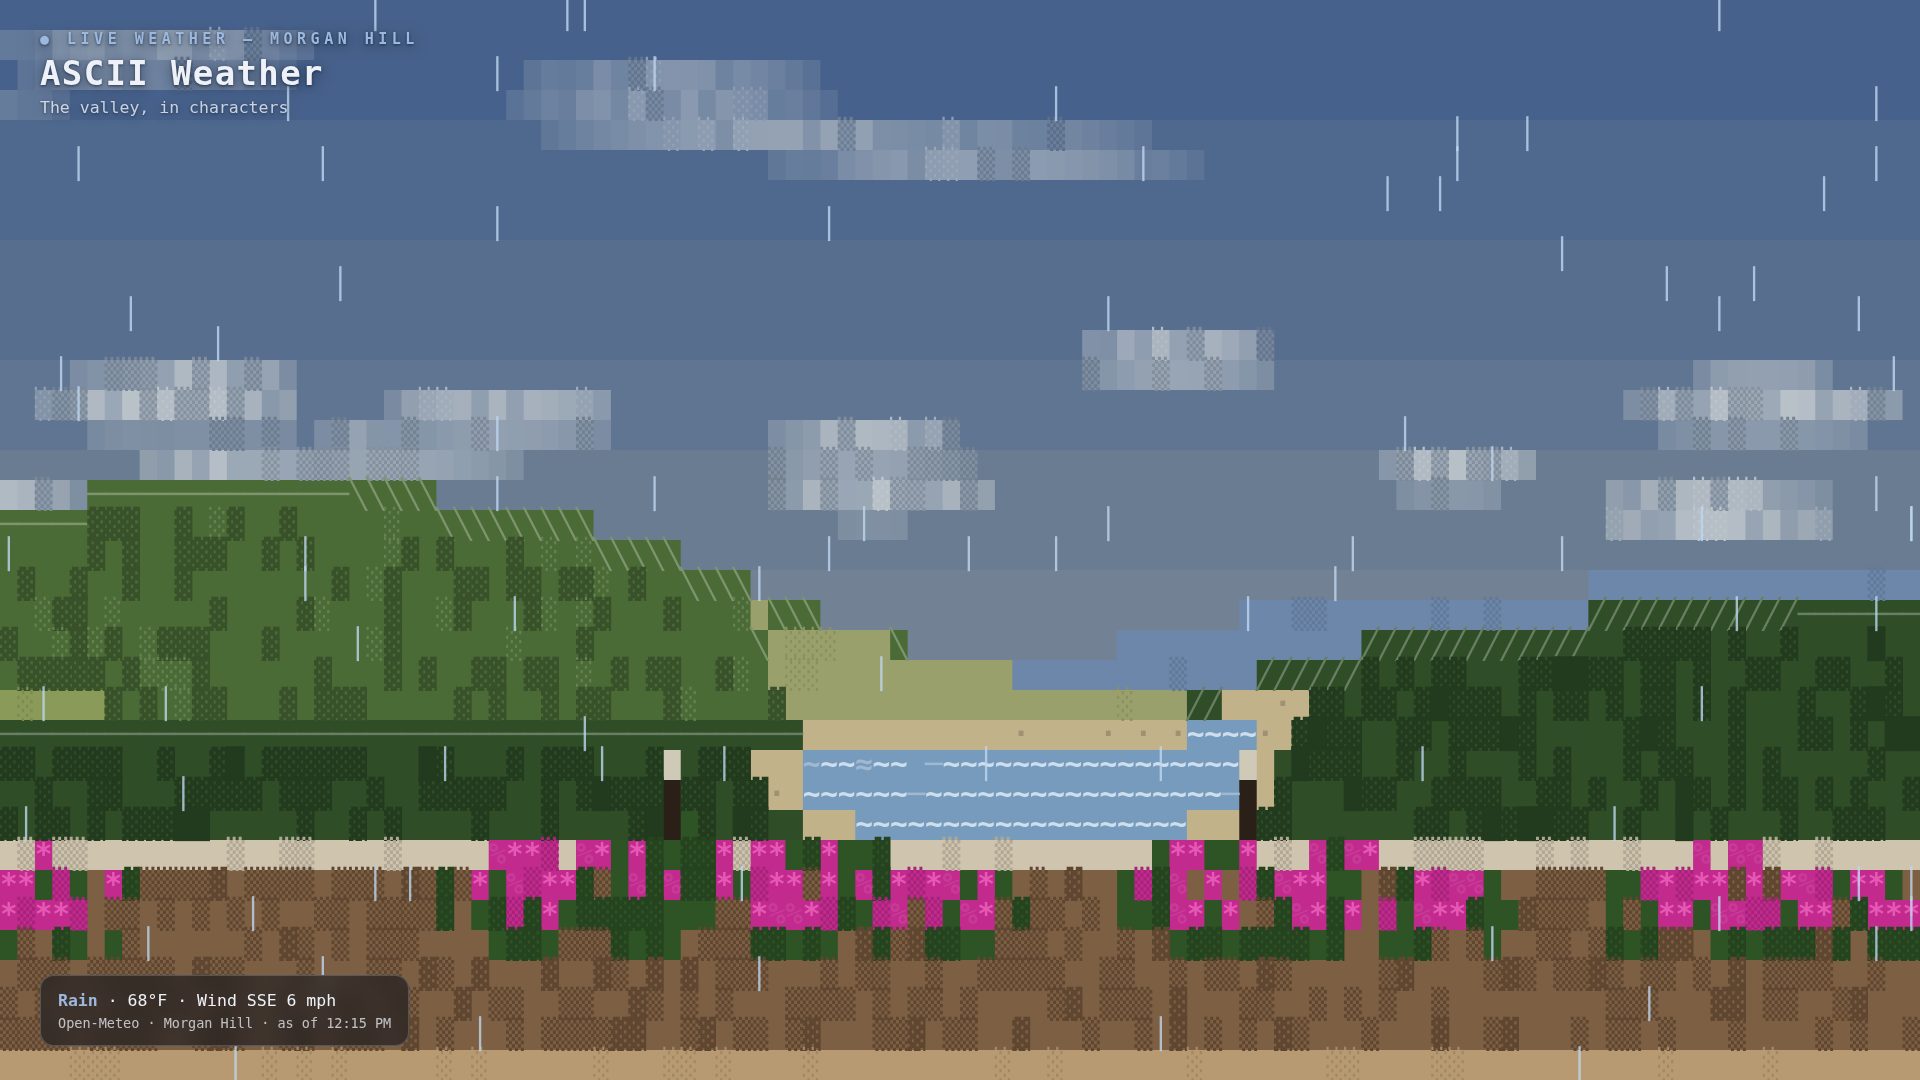
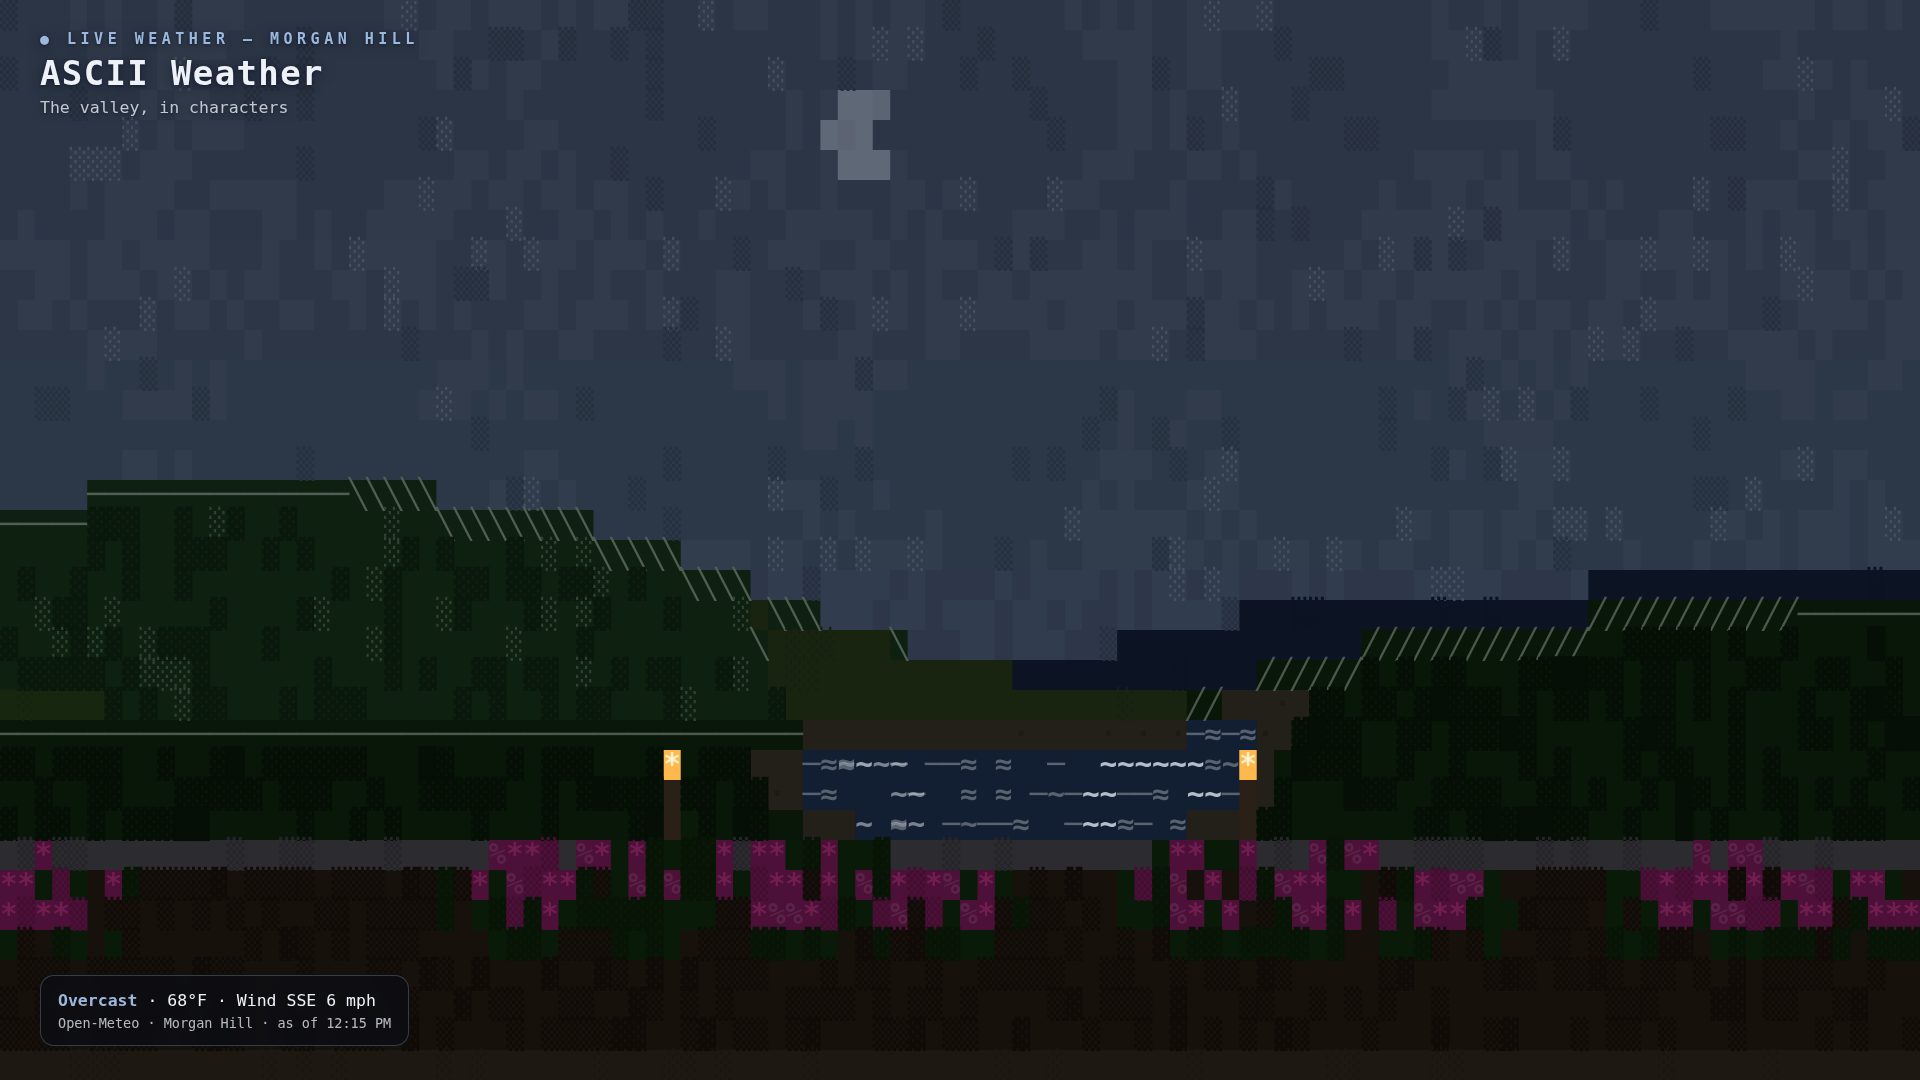
One landscape, traced once from the photograph — copied by hand, ridge by ridge — and everything that changes in it is the live weather, read again every fifteen minutes.
What you're making
A web page that draws your view, in characters — a grid of 110 columns by 36 rows, 3,960 cells in all, each cell a flat colour with one bold glyph (a single character) standing in it — and then runs the actual weather over it.
Clouds drift at the speed of the real wind, in the real wind's direction. Rain slants, snow wanders, fog gets in between the ridges and unmakes the far ones first. The sun crosses on your real sunrise and sunset; at night there's a moon in roughly its real phase, stars under clear skies, and the terrace lamps lit. Every fifteen minutes the page asks the sky again.
It's one of the screens in my house — the full system is written up in The House Screens Project — but like the Flights Overhead scope, this page stands alone. You don't need the rest of the system to run it.
Try it with your own photo
Below, the live screen runs my landscape under your sky. This one runs your picture. Pick a photo — the view from your own window is the obvious candidate — and the page breaks it down into the same coarse grid the screen uses: every cell a flat colour, one bold glyph standing in it, contour strokes where the picture has edges.
Your photo never leaves your browser — the conversion happens on your device. Nothing is uploaded, nothing is tracked, and there is no server in this at all: the file you pick is read by this page and gone when you close the tab.
This is Step 3 of the recipe, live: your photo, sampled into the grid. Tracing it into a landscape is the step after. Slide the grid coarser and the picture turns into shapes you can read across a room; finer, and it melts back into a photograph. The screen in this post lives at 110 columns. When it looks right, take it away as a PNG.
Drop a photo here, or use the button below.
Try it before you build it
You don't have to take the screenshots' word for any of this. The screen itself is embedded below, live. It opens on a labelled sample town — type yours, and the valley keeps my landscape but takes your sky: your conditions, your wind, your sun times.
The two ideas to steal
Weather is free, and weather is data. Open-Meteo is a weather service built on national weather models that answers, for any latitude and longitude on Earth: what's it doing there right now, and when are today's sunrise and sunset? No account, no sign-up, no charge. One short answer from the service carries a code for the conditions, the wind's speed and direction, and the sun times — everything a scene needs to act out the sky. This page is a drawing; the weather underneath it is a public utility.
You don't generate the landscape. You trace it. Most ASCII scenery is either converted from an image by a program (which reads as mush at TV distance) or generated from noise (which looks like everywhere and nowhere). A tracing is different: I spent an hour with my own photograph, dividing it into horizontal bands and writing down where each ridge crosses the frame. The result only looks like one place on Earth — which is the point. It's a portrait, not a screensaver.
What you need
- The page. It's free, two ways: download the complete file (34 KB, everything inline), or take it from my open-source house-screens repo, github.com/Caitria/MaudeAtHome, at screens/pages/ascii-weather.html.
- A photograph of your view. The one from your window, your porch, your fire escape. Landscape orientation, taken in decent light.
- Your latitude and longitude. Long-press your house in any map app; it will show you two numbers. Those are the only personal values in the file, and the file ships with placeholders where yours go.
- Any screen with a browser — a TV you can cast to, a spare tablet, an old laptop. An always-on computer (I use a Raspberry Pi) only if you want it living on a wall.
- About an hour, most of it tracing.
The steps
- Step 1 — Take the photo like a landscape painter. You want bands. Stand where the view stacks up in horizontal layers: sky, far hills, mid slopes, water or fields, near ground, and whatever is closest to the camera. The flatter the stack, the better it traces. My photo has six bands and one strong diagonal — the big hill — which is about as complicated as this gets.
- Step 2 — Trace the landscape into layers. For each band, write down its top edge as a list of points, in fractions of the frame: how far across, how far down, each between 0 and 1. Here is the left hill from my photo, exactly as it sits in the code:
var LEFT_PTS = [[0, 0.462], [0.08, 0.455], [0.16, 0.452], [0.24, 0.460],
                [0.30, 0.478], [0.36, 0.518], [0.415, 0.558], [0.47, 0.598],
                [0.53, 0.632], [0.60, 0.656], [0.68, 0.668], [0.76, 0.672]];
Read it as a walk along the crest: at the left edge the hill starts 46.2% of the way down the frame, stays high and nearly level for a quarter of the width, then falls steadily to the valley notch at centre. The page joins the dots with straight lines — at 110 columns, straight lines are all the eye asks for. Do this for every band, back to front: sky, far ridge, mid slopes, water (a closed shape, traced all the way around), near hill, foreground. Then colour them with atmospheric perspective: the farther a layer is, the paler, bluer, and lower-contrast it gets. That one rule is most of what makes the drawing read as distance instead of a stack of cutouts. Details — the oak speckles on my light slope, the flower clusters on the wall — are just small shapes stamped on top of their band.
- Step 3 — Keep the grid coarse. 110 × 36 cells. Each cell gets a background colour from its layer and one glyph chosen by what the cell is:
clouds ░ ▒    hills ▓ █    water ~ ≈ ─    ridge crests ╱ ╲ ─
rain │ ╲ ╱    snow * •     flowers * %    stars · +
Two things make this work. First, coarse is a feature: at couch distance a fine grid dissolves into grey texture, while big cells read as shapes — and a few thousand cells is nothing for any browser made this century, which is why no library is needed. Second, the crest glyphs follow the slope: the top cell of each ridge is drawn ╱ where the ridge climbs, ╲ where it falls, ─ where it's level. That single contour line is what turns a green blob into a hill with a direction. (My first moon came out oval, by the way — character cells are taller than they are wide, so anything round has to be computed with the cell shape folded in, or it comes out wrong in a way you can't unsee.) And if you want to watch a photograph get sampled into the grid before writing any code, the converter at the top of this post does exactly that, live.
- Step 4 — Wire the weather. The page fetches one URL, with your two numbers where the placeholders are:
https://api.open-meteo.com/v1/forecast?latitude=YOUR_LAT&longitude=YOUR_LON ¤t=temperature_2m,weather_code,wind_speed_10m,wind_direction_10m &daily=sunrise,sunset&timezone=auto
The heart of the answer is weather_code — one number, from the World Meteorological Organization's code table, that says what the sky is doing. The page translates codes into scene classes, and each class is a small set of acting instructions:
| Codes | Sky | What the scene does |
|---|---|---|
| 0 | Clear | Sun on its arc by day; stars and the moon at night; a few high clouds |
| 1–2 | Partly cloudy | Drifting cumulus, moving with the real wind |
| 3 | Overcast | One compressed grey mass; sun gone; everything dims a step |
| 45, 48 | Fog | Pale bands settle between the ridges; the far ridge nearly vanishes |
| 51–55 | Drizzle | Thin rain; rings starting on the water |
| 61–82 | Rain | Rain at the code's weight, slanted by the wind; rain rings on the lake |
| 71–86 | Snow | Slow flakes, drifting sideways on the wind |
| 95–99 | Thunderstorm | Heavy rain, and every so often the whole sky lifts — a soft double pulse, never a strobe |
The rest of the acting is arithmetic: cloud drift speed scales with the reported wind, the lake's shimmer speeds up with it too, and the sunrise and sunset in the same answer drive the palettes — day, a golden window around each sun event, and night, when the moon (phase estimated from the date) takes over and the foreground lamps light. If a fetch fails, the page keeps the last true sky and labels it stale. It never invents weather.
- Step 5 — Put it on the big screen. The minimum version is: open the file in a browser and press F11. The wall version is the house pattern: serve the file from any always-on computer and cast a browser tab to the TV, or open it in the TV's own browser. My screens are driven by a Raspberry Pi and a phone controller — that machinery is written up in The House Screens Project, and none of it is required for the page itself to work.
The whole file, and what isn't in it
The download above is the complete screen — landscape, weather, acting, all of it, in one file you can read end to end. Worth saying plainly: libraries used: none. No framework, no build step, no packages. It's plain JavaScript drawing in the browser, in your system's monospace font. That's a deliberate choice for a thing meant to live on a wall for years: there is nothing in it that can be deprecated, acquired, or broken by somebody else's release. If you can read the file, you own the whole machine.
Honest limits
- It's traced, not generated. The hour with the photograph is the price of a scene that looks like somewhere. If you'd rather have scenery that invents itself, the standard tool is fBM noise — layered random waves that sum into ridgelines — and Iñigo Quilez's write-up (in the sources) is the canonical explanation. Generated ridges are good. They just aren't yours.
- The weather is as local as the forecast grid. Open-Meteo reads a weather model, not your garden. A ridge between you and the grid point can give you sun under a drawn overcast. The page reports the sky it was given, labelled with its source and read time.
- Coarse is load-bearing. At 110 × 36 the page is trivially cheap. Finer character grids multiply the cells fast, and I haven't tested them on cheap TV hardware — my other ASCII screens that work at finer grain are noticeably heavier. If you refine the grid, test on the actual screen you mean to use.
- The moon is approximate. Its phase is estimated from the date with arithmetic, not astronomy software. It's right to the eye; don't set a ritual by it.
Where I learned this
This page stands in a small, old tradition: animated scenes drawn in characters. bas3line's landscape — a mountain range over a still lake, under the real sky of wherever you are — is the closest prior art, and the proof that a text scene can carry real time. weathr, a terminal program that draws a little house under your actual weather, supplied the checklist of conditions a scene has to handle. The shape-matching school of ASCII rendering — Alex Harri's shape vectors, and Stefano Lunardi's shape-aware renderer — powers my finer ASCII work (a koi pond elsewhere in the house); this page deliberately takes the other fork, big honest blocks. And the credit for the weather itself goes to Open-Meteo and the public weather models underneath it.
That's the whole recipe. Your window already has the view; the sky over it is already being measured and given away. Trace one, wire the other, and the wall between them does the rest. If you build one, I want to see what your weather looks like in characters.
Sources
- Open-Meteo — open-meteo.com. The free weather API (no key, no account) whose current conditions and sun times drive the scene, and whose geocoding API powers the demo's town lookup.
- bas3line — landscape, from the ascii pieces library: ascii.hexdocs.pm. A range over a mirrored lake under the viewer's real sky; the closest template for this page, which swaps its generated range for a traced one. Library: github.com/bas3line/ascii.
- weathr — github.com/veirt/weathr. A Rust terminal program that renders an animated scene from real Open-Meteo conditions; its condition list (clear through thunderstorm-hail, day and night) is the checklist this page works to.
- Iñigo Quilez — fBM noise and dynamic clouds, iquilezles.org. The standard maths for generated ridgelines and for clouds built from drifting noise octaves — the road not taken here, documented for anyone who'd rather generate than trace.
- Alex Harri — “ASCII characters are not pixels”. Shape-vector glyph matching: characters chosen by the shape of what's in the cell, not just its brightness.
- Stefano Lunardi — “Beyond the Luminance Ramp”, Codrops. A shape-aware ASCII renderer; the lineage of this house's finer ASCII screens, where glyphs are matched by shape.
- MaudeAtHome — github.com/Caitria/MaudeAtHome. The page itself (screens/pages/ascii-weather.html), its ASCII siblings, and the whole house-screens system, published open source.
- The House Screens Project — caitriaoneill.com/blog/house-screens-project/. The system this page lives in: the Pi, the displays, and the automations around it.
FILED UNDER — HOUSE SCREENS · MAKE YOUR OWN · BLOG · NOVEMBER 2026